
Join the Stackmode Trading School for live chart analysis, candlestick pattern recognition, and systematic trading education.
Quick Answer: Body Shows Momentum, Wicks Show Rejection
Candlestick bodies represent the open-to-close price range and show momentum strength. Wicks show the high and low extremes and indicate price rejection at those levels. Reading bodies and wicks together reveals market psychology: who won the period, how strong the move was, and where price got rejected.
The key is context. A long body in a strong trend confirms momentum. A long wick at a key level shows rejection and potential reversal. The same candle in the middle of nowhere means nothing. Always read bodies and wicks within the broader market structure, not as isolated patterns.
Watch the Video: How to Understand Candle Bodies and Wicks
Watch the step-by-step lesson, then use this guide to practice reading candle anatomy on your own charts.
Candlestick Anatomy Basics
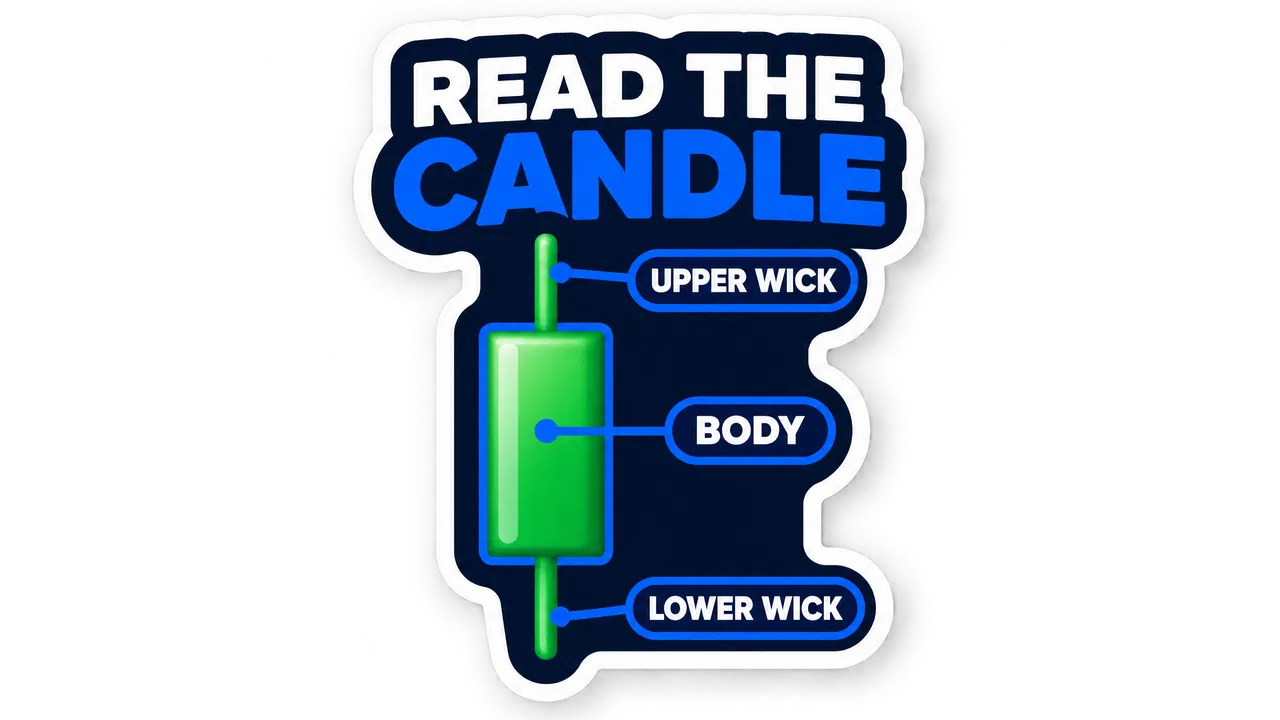
Every candlestick has two main components that tell you what happened during its time period:
Body
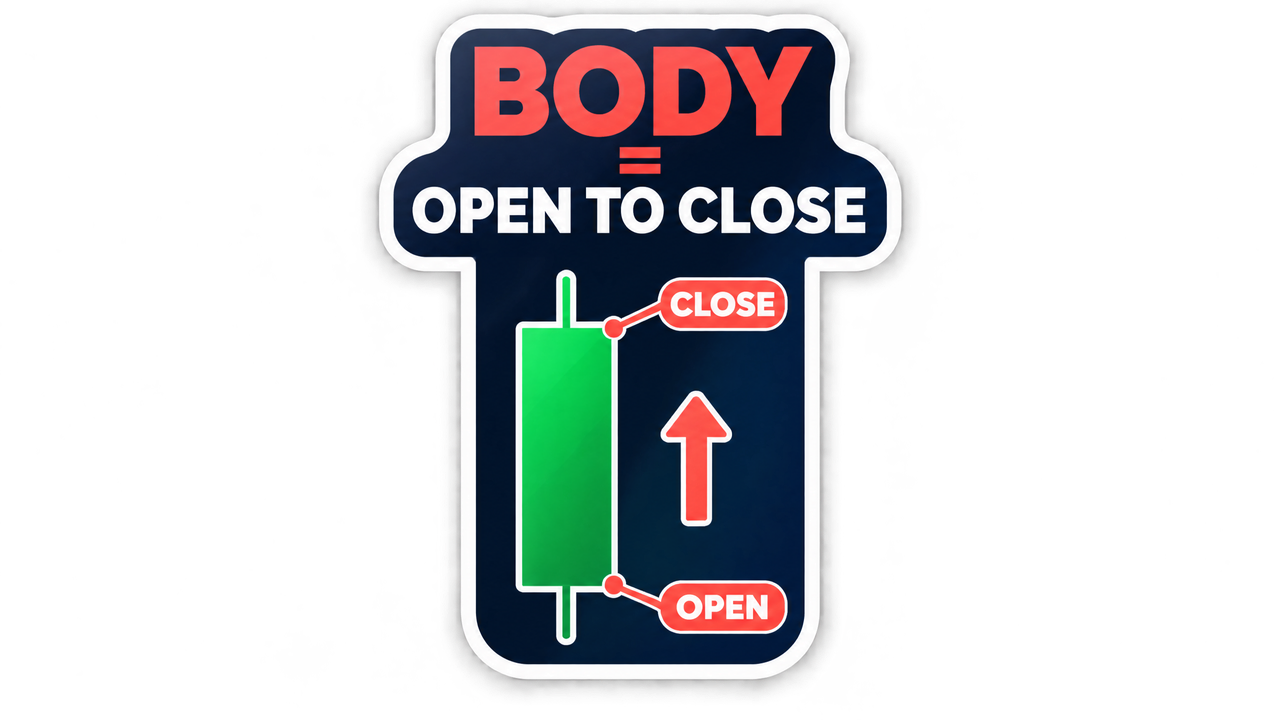
The thick rectangular part shows the open and close price. The distance between open and close represents the net price movement. Body size indicates momentum strength and conviction.
Wicks (Shadows)
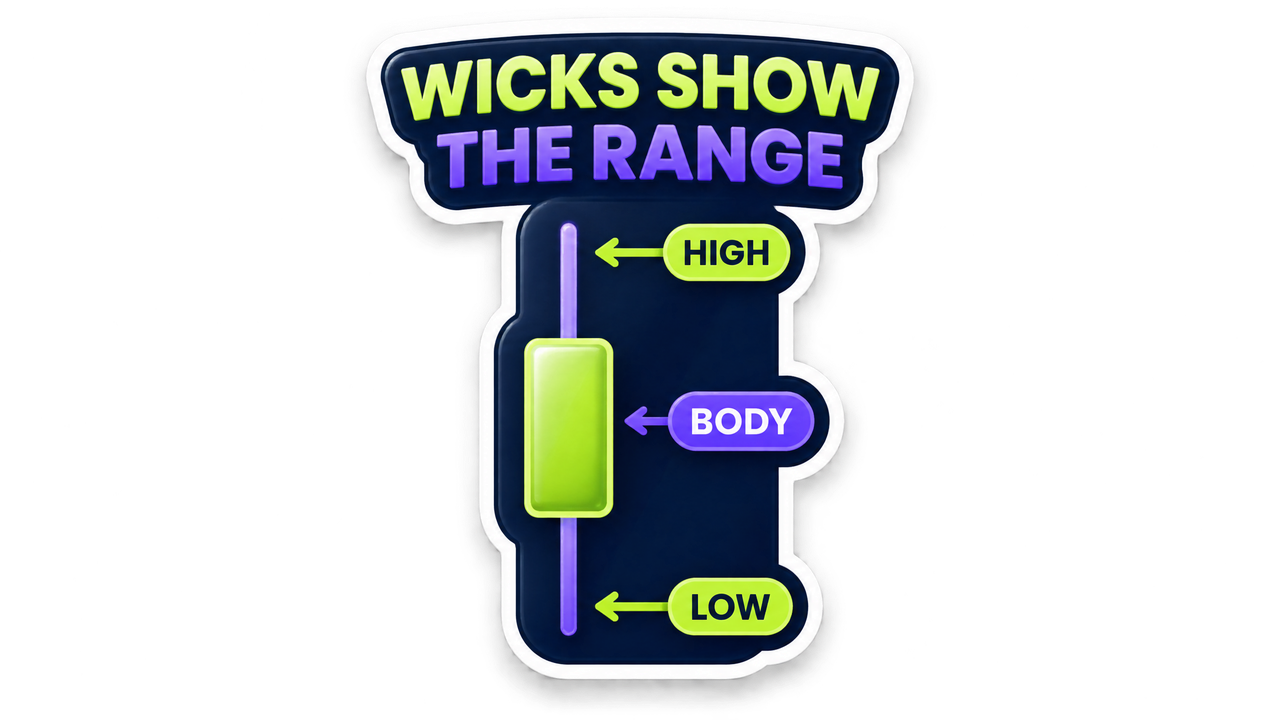
The thin lines above and below the body show the high and low extremes. Upper wicks show rejection at higher prices, lower wicks show rejection at lower prices.
What Body Size Tells You
Body size is a direct measure of momentum and conviction:
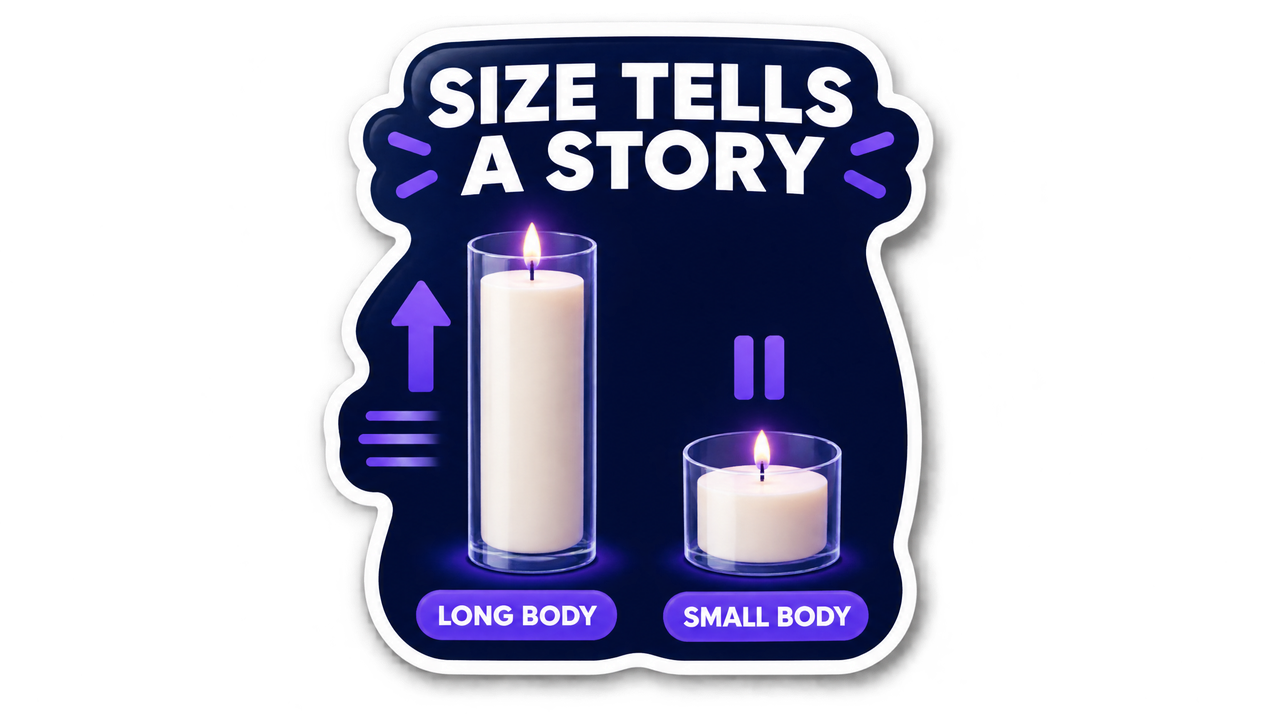
- Long body: Strong momentum and conviction. Buyers or sellers controlled the period with little opposition. Often confirms trend strength.
- Short body: Weak momentum or indecision. Price moved little between open and close. Often signals consolidation or potential reversal.
- Increasing body size: Momentum is accelerating. Trend may be strengthening.
- Decreasing body size: Momentum is fading. Trend may be exhausting or reversing.
- No body (doji): Open and close are nearly the same. Shows complete indecision between buyers and sellers.
What Wicks Reveal
Wicks show where price tried to go but got rejected:
Long Upper Wick
Price pushed higher during the period but sellers pushed it back down. Shows rejection at higher prices. Often appears at resistance levels.
Long Lower Wick
Price pushed lower during the period but buyers pushed it back up. Shows rejection at lower prices. Often appears at support levels.
Long Wicks Both Sides
Price swung both ways but closed near the open. Shows high volatility and indecision. Neither buyers nor sellers could maintain control.
No Wicks (Marubozu)
Price stayed between open and close the entire period. Shows strong one-sided control. No rejection at the extremes.
Reading Bodies and Wicks Together
The real insight comes from combining body and wick analysis:
- Long body + short wicks: Strong directional move with little rejection. Trend is likely to continue.
- Short body + long wicks: Indecision with rejection at extremes. Potential reversal or consolidation.
- Long body + long opposite wick: Strong move but with rejection at the close. May signal exhaustion or temporary pullback.
- Small body + long wicks: High volatility but no net progress. Market is deciding direction.
- Body position within wicks: If body is near the top of the range, buyers won. If near the bottom, sellers won. If centered, indecision.
Context is Everything
Bodies and wicks only have meaning in context. Always consider:
- Support and resistance: A long wick at a key level is significant. The same wick in the middle of a range means nothing.
- Trend structure: Long bodies with the trend confirm momentum. Long bodies against the trend need more confirmation.
- Volume: High volume on a strong body shows institutional participation. Low volume shows weak conviction.
- Multiple timeframes: Check the candle on higher timeframes for context before trading lower-timeframe signals.
- Previous candles: Compare the current candle to recent candles. Is body size increasing or decreasing? Are wicks growing or shrinking?
Common Reading Mistakes
- Trading single candles: Entering based on one candle without checking levels, trend, or broader context.
- Ignoring body size: Focusing only on wicks or patterns without considering momentum strength shown by body size.
- Overreacting to wicks: Assuming every long wick means reversal when it may just be temporary rejection.
- No level context: Reading candles the same way at key levels and in the middle of nowhere.
- Forcing meaning: Trying to find significance in every candle instead of waiting for clear signals at key areas.
Best-Fit Framework: Who This Approach Suits
This body and wick reading method works best for:
Price Action Traders
Traders who prefer reading raw price movement instead of relying on lagging indicators.
Swing Traders
Traders holding positions for days who use higher-timeframe candles for structure and entry timing.
Beginner Traders
Traders new to charts who need to understand candle anatomy before learning complex patterns.
Halal-Conscious Traders
Traders focusing on spot markets where candlestick analysis applies directly without derivative complications.
Reading Checklist Before Any Trade
Before acting on a candlestick body or wick signal, confirm:
- The candle occurs at a key support or resistance level.
- Body size shows the expected momentum for your setup.
- Wicks show rejection at meaningful levels, not random noise.
- Volume confirms the move (higher volume on strong bodies is better).
- The candle aligns with the higher-timeframe trend structure.
- You have defined your invalidation level before entry.
- Dollar risk fits your account and per-trade rules.

Best-Fit Framework: What This Topic Can and Cannot Tell You
How to Understand Candle Bodies and Wicks is best understood as an educational framework: define the decision, compare the available choices, verify current evidence, and keep the downside explicit before acting.
| Option or lens | Best for | Honest limit |
|---|---|---|
| Definition | Clarifying what the topic actually means | A definition does not predict a market outcome. |
| Process | Turning the idea into repeatable research steps | A process still depends on execution and current conditions. |
| Risk check | Sizing uncertainty and writing invalidation rules | Risk controls reduce exposure; they do not remove loss. |
Research Checklist and Related Stackmode Lessons
Use primary sources for current rules and the related Stackmode pages for connected market context. The links are learning paths, not promises that a result will transfer from one market or person to another.
Visual Study Opportunities
These are useful visual checkpoints for a future revision or companion graphic. They make the explanation easier to scan without presenting an unverified chart, number, or performance claim as proof.
- 1. A one-sentence definition card with the key term highlighted.
- 2. A labeled process diagram showing research before execution.
- 3. A comparison table with the same criteria across alternatives.
- 4. A before-and-after example that clearly labels assumptions.
- 5. A timeline showing which facts are current and which are historical.
- 6. A risk ladder from low complexity to high complexity.
- 7. A checklist for source, date, cost, liquidity, and invalidation.
- 8. A worked example using hypothetical values rather than a promise.
- 9. A common-mistakes graphic with the correction beside each mistake.
- 10. A final decision tree showing when to pause and verify more evidence.
Expanded FAQ
What is the main idea of this article?
The main idea is to understand how to understand candle bodies and wicks as a process with defined assumptions, risks, and verification steps rather than as a guaranteed outcome.
Who is this article for?
It is for readers who want an educational framework before making a market, trading, or investing decision.
What should a beginner do first?
Start with the definition, identify the instrument or market involved, and write down the risk before thinking about an entry or action.
What information should be verified?
Verify the product rules, current data, costs, timing, liquidity, source date, and any claim that could change the decision.
What is the biggest mistake to avoid?
The biggest mistake is treating an educational explanation as a promise and skipping independent risk checks.
How does risk management fit in?
Risk management sets the position size, invalidation point, maximum loss, and review process before execution.
Can this approach guarantee a profit?
No. Markets are uncertain, and no framework can guarantee a profit or remove loss risk.
How current is this information?
Market rules, prices, products, and policy can change, so check the dated primary source before acting.
Should this replace professional advice?
No. It is general education, not personalized financial, tax, legal, or investment advice.
How should readers compare alternatives?
Compare the same criteria: purpose, issuer, liquidity, costs, volatility, custody, time horizon, and honest limitations.
What should be written in a trading plan?
Record the thesis, setup, entry condition, invalidation, size, maximum loss, exit logic, and review date.
Why do source dates matter?
A dated source shows when a rule, number, or statement was true and helps expose stale or unsupported claims.
How can readers reduce confirmation bias?
Write what would disprove the thesis, review opposing evidence, and avoid relying on one headline or one chart.
What is a sensible next step?
Use the article as a checklist, verify the primary sources, and practice with risk that is small enough to survive mistakes.
Conclusion: Use the Framework, Then Verify the Decision
How to Understand Candle Bodies and Wicks is best understood as an educational framework: define the decision, compare the available choices, verify current evidence, and keep the downside explicit before acting. The useful takeaway is not a prediction. It is a repeatable process: define the topic, compare the available choices, verify current sources, size risk conservatively, and record what would change your mind.
Stackmode provides educational market context, not guaranteed returns or personalized financial advice. Recheck current rules, prices, liquidity, and tax implications before acting.
Get The Free Pullback Guide
Learn exactly when to enter pullback trades with this step-by-step guide. No guessing, no confusion—just the exact framework I use to time entries in stocks and crypto.
- Step-by-step pullback entry framework
- Risk management rules for every trade
- Real chart examples with marked entries
- Works for stocks, crypto, and futures
100% Free • No credit card required
Trading Books
Keep Learning After The Article
Buy the books directly from Amazon or Google Play and keep building your trading psychology, Bitcoin understanding, and long-term market awareness.
Neuro Trading
Master the psychology of trading.
- Why 90% of traders lose and how to think like the 10%
- Emotional discipline techniques used by stronger traders
- A mindset framework built for long-term execution
eBook
$9.99
Paperback
$19.99
Audiobook
$9.99

Before The Hype
How to spot opportunities before they go viral.
- Learn the asset stacking strategy for long-term wealth
- Find high-signal trends before they become crowded
- Think earlier instead of chasing late momentum
eBook
$9.99
Paperback
$19.99
Audiobook
$9.99

Freedom Money
Understand Bitcoin and what it does.
- A cleaner beginner path into Bitcoin
- Protect and grow money with stronger awareness
- Build conviction before you move capital
eBook
$9.99
Paperback
$19.99
Audiobook
$9.99
Master Candle Reading In The Trading School
Pick one clean next action instead of bouncing around the site.
Best value
StackMode Trading School
Join the Whop group for live group sessions, real-time stock and crypto trade alerts, organized video lessons, StackFinder access, and a Halal spot-trading framework.
Live class plan
Live Group Sessions Included
Bring questions, review charts, and learn the same repeatable process with students moving through the class plan together.
StackFinder
StackFinder Member Tools
AI scanner, personal watchlist, daily stock and crypto setups, dashboards, and trade-prep tools are included with the group.