Use this beginner guide as the starting point, then move into trading mentorship, books, or Academy if you want more structure around Bitcoin and market analysis.
Quick Answer: Read The Bitcoin Chart By Finding Structure Before You Hunt Entries
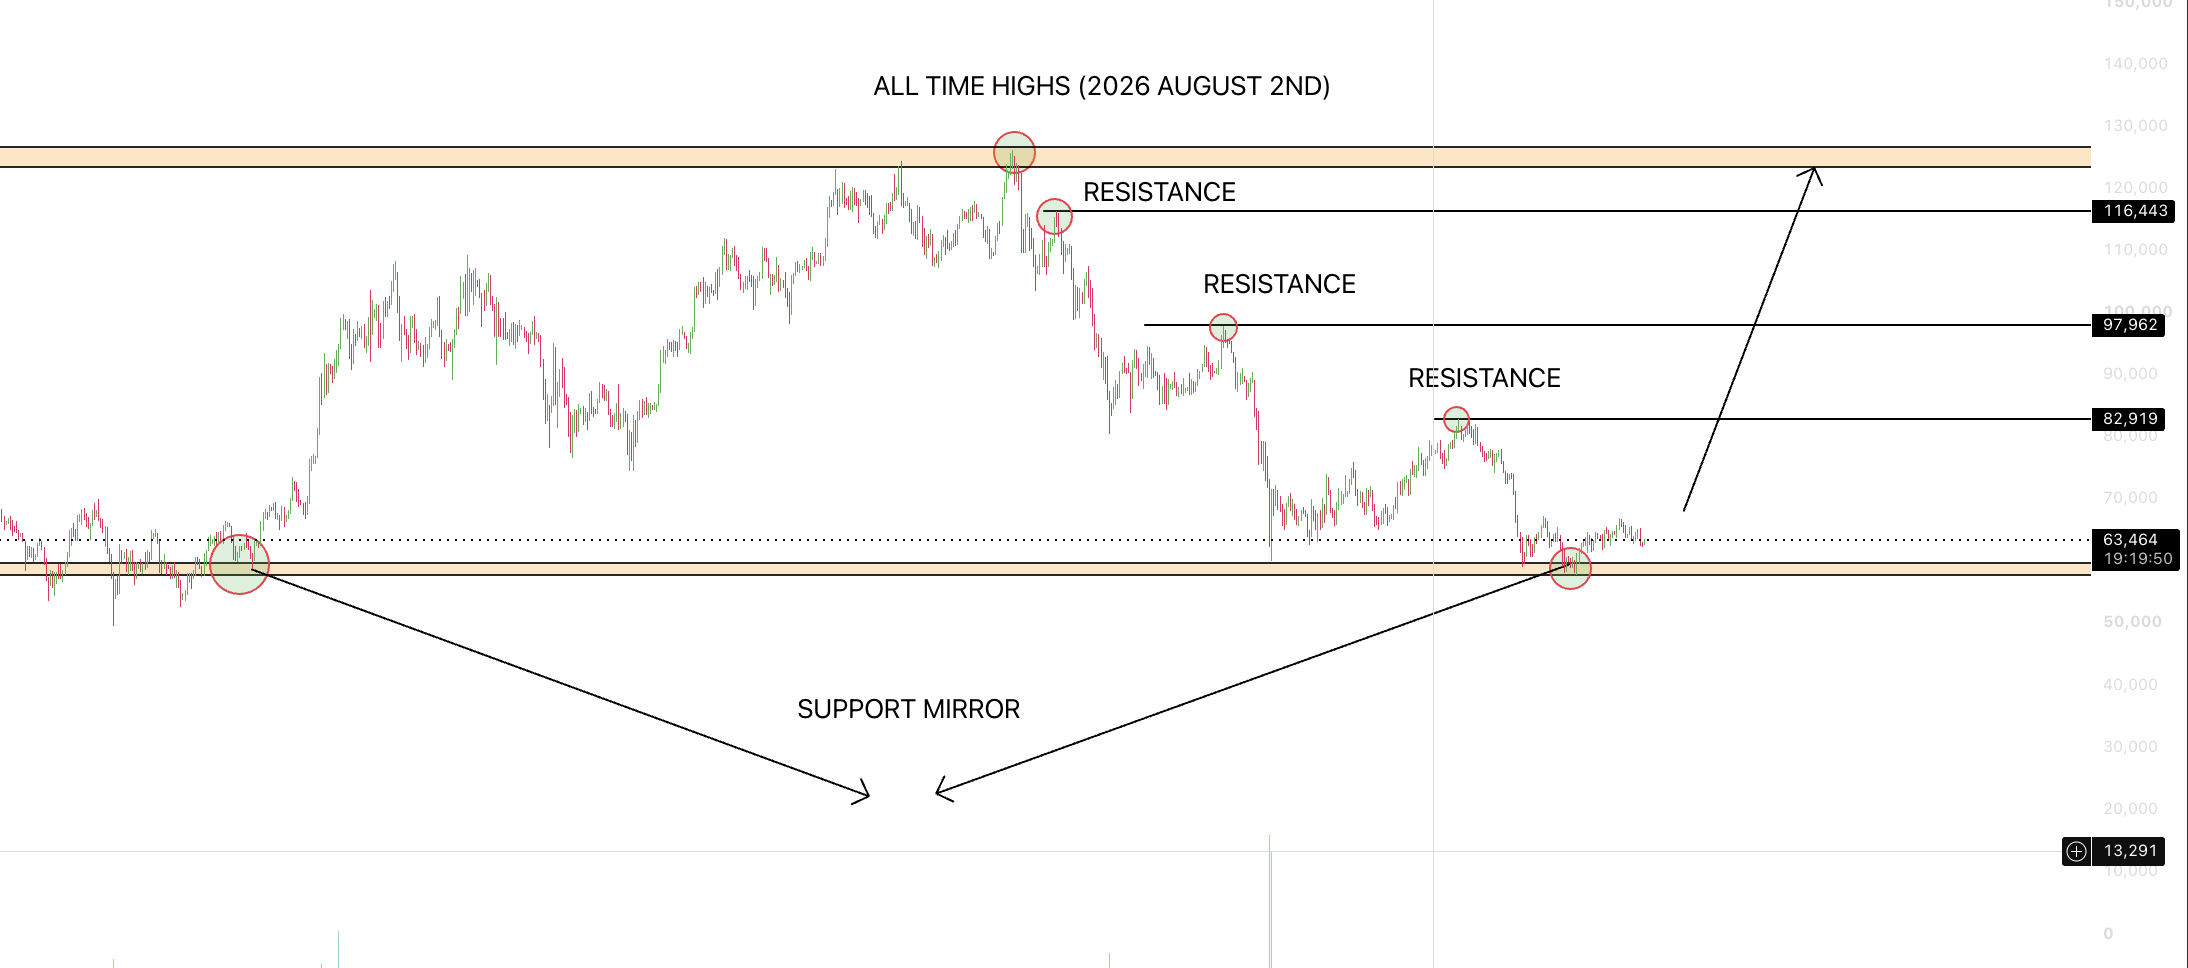
The simplest way to read a Bitcoin chart is to first identify the broader structure. Look for where price is trending, where buyers keep stepping in, and where sellers keep rejecting moves higher.
Beginners usually get lost because they stare at every candle instead of starting with the bigger picture. If you can find support, resistance, and trend direction, the chart immediately becomes easier to understand.
Watch the Video First
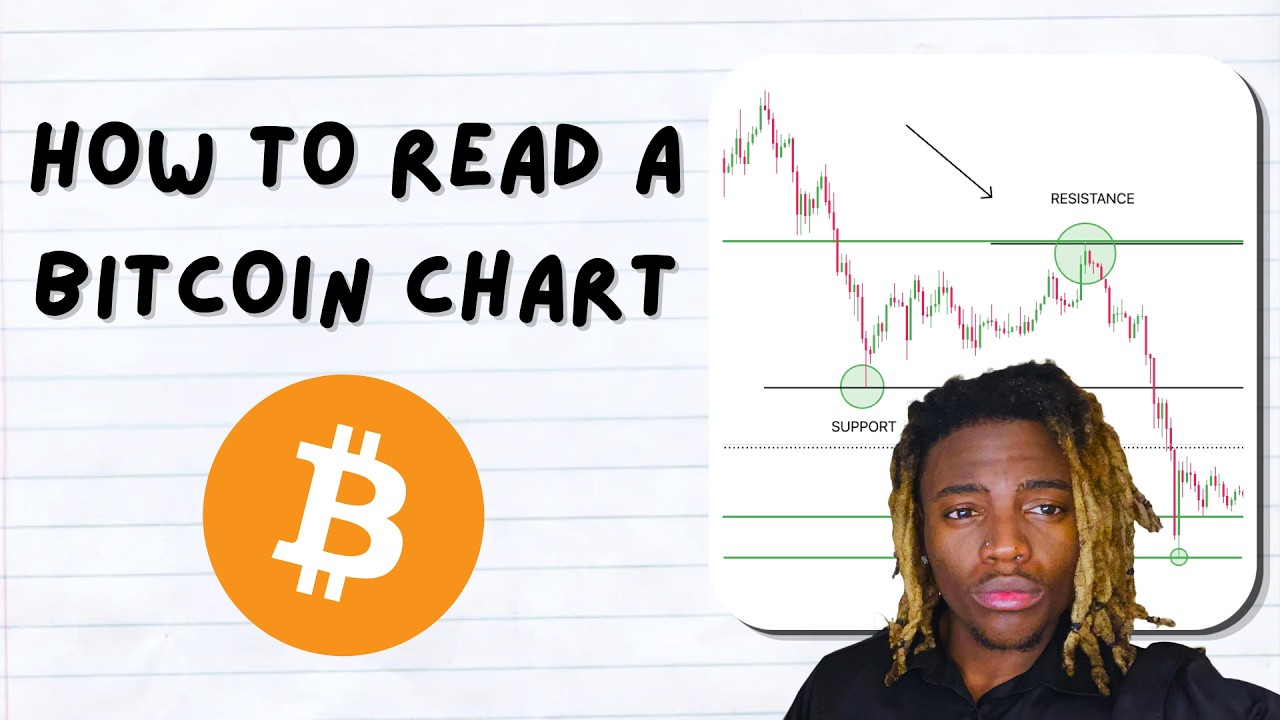
This article expands on the StackModeChris walkthrough. Watch the video first if you want the fast visual version, then use the written guide below to slow everything down and understand what the chart is showing.
Start With Structure, Not Random Candles
Most beginners make chart reading harder than it needs to be. They zoom in too much, focus on tiny moves, and forget that the bigger structure controls most of the important decisions.
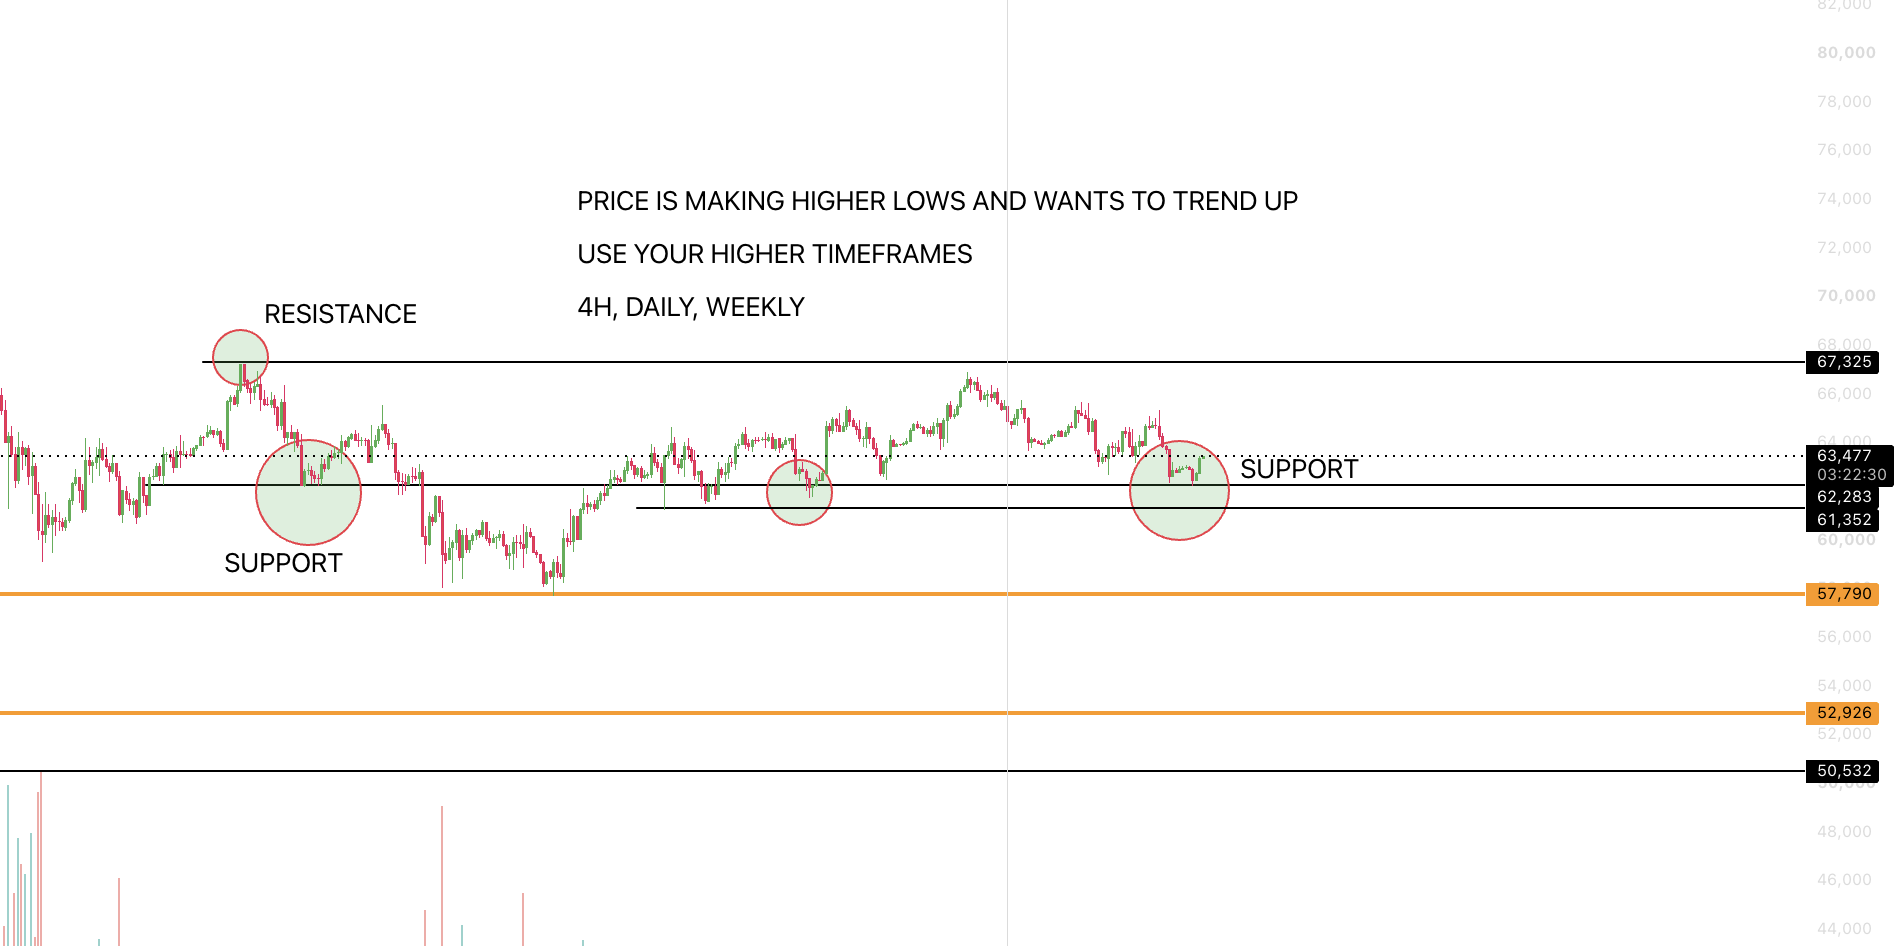
When you step back, you can ask better questions: Is Bitcoin making higher lows? Is it bouncing from support? Is price trapped below resistance? That is where real chart reading begins.

Support and Resistance Give The Chart Meaning
Support is where price keeps finding enough buying interest to hold up. Resistance is where price keeps getting rejected because sellers step in. Those repeated reactions create the map that helps you understand what Bitcoin is doing.
A chart without levels is just movement. A chart with support and resistance starts to tell a story about where buyers are defending and where price still has work to do.
Use Higher Timeframes To Reduce Noise
Higher timeframes help beginners avoid getting trapped by every little candle. The 4-hour, daily, and weekly views are usually cleaner for understanding what Bitcoin is trying to do overall.
If higher timeframes show price building from support and pushing into resistance, that gives you more context than staring at a fast chart with no structure. Bigger charts make the important levels easier to trust.
Beginner Mistakes That Make Bitcoin Charts Harder To Read
- Zooming in too far before checking the daily or weekly chart.
- Treating support or resistance like one perfect line instead of a zone.
- Trying to predict every move instead of reading the current structure.
- Taking every candle personally instead of waiting for repeated reactions.
- Thinking chart reading removes risk or guarantees a profitable trade.
The goal of chart reading is not to look smart. The goal is to become more structured. If the chart helps you recognize support, resistance, and trend direction, it is already doing its job.
Honest limit: a clean chart read still does not guarantee that Bitcoin will respect the level. Markets can break support, rip through resistance, and invalidate the idea. The chart gives context, not certainty.
FAQ
What should a beginner look at first on a Bitcoin chart?
A beginner should start with structure: where price is trending, where support is holding, and where resistance keeps rejecting price. That gives context before smaller details matter.
What is support on a Bitcoin chart?
Support is an area where price keeps finding buyers and stabilizing. It is not always one exact line, but it often acts like a zone where selling pressure slows down.
What is resistance on a Bitcoin chart?
Resistance is an area where price keeps struggling to move higher because sellers step in. Repeated rejection at the same region usually makes that level more important.
Why should beginners use higher timeframes?
Higher timeframes reduce noise. Looking at the 4-hour, daily, or weekly chart makes it easier to see the real structure instead of getting trapped by random small moves.
Does reading a Bitcoin chart guarantee profitable trades?
No. Chart reading improves understanding, but it does not remove risk or guarantee results. It only helps a trader make more structured decisions.
If you want more beginner trading structure, visit Trading mentorship and education. For the Bitcoin mindset angle, the book section below also gives you direct paths into your next read.
Want Help Reading Charts With More Clarity?
Pick one clean next action instead of bouncing around the site.
Trading
Trading Classes $50/hour or $450 for 10
Schedule first, then work through chart reading, support levels, entries, exits, risk, psychology, and review with StackmodeChris.
Catch Our Trades
Catch Our Trades
Real-time trading entries, trade recaps, and market breakdowns from StackmodeChris.
StackFinder
StackFinder Research Tools
Free market scanner, watchlists, and trade-prep tools for stocks, options, futures, forex, and crypto.