This stock chart guide gives you the map. If you want more structure after that, use the mentorship, books, and Academy paths already built into the trading articles.
Quick Answer: A Stock Chart Becomes Easier When You Treat Levels Like Landmarks
The easiest way to read a stock chart like a map is to stop staring at every candle and start identifying the important landmarks. Those landmarks are usually support, resistance, and zones where price has already reacted more than once.
Once you can see where price is respecting or rejecting levels, the chart starts making more sense. Instead of random movement, it becomes a path with places that matter.
Watch the Video First
This article expands on the StackModeChris video. Watch the video first if you want the quick visual walkthrough, then use the written version below to slow the lesson down and make the chart-reading process clearer.
Read Structure Like A Map, Not Like A Mystery
Traders get confused when they look at charts without context. They see candles moving and think they need to predict every next tick. That usually makes chart reading harder.
A map is easier because it has landmarks. A stock chart works the same way. If you mark where price has repeatedly reacted, the chart starts telling you what zones are important instead of looking like noise.
Mark Support and Resistance Before Anything Else
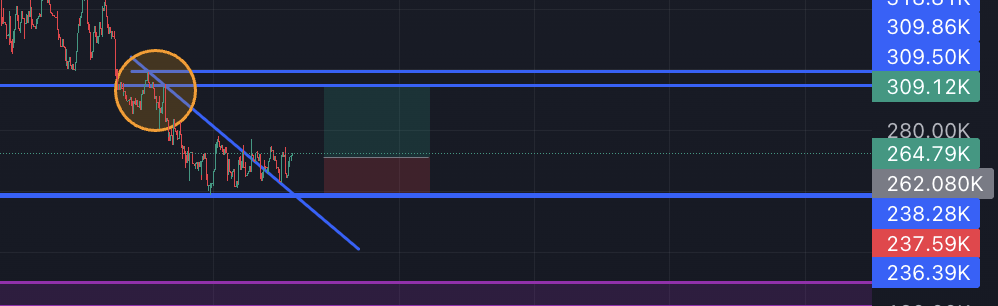
Support is where buyers keep stepping in. Resistance is where sellers keep showing up. Those two ideas give the chart most of its structure.
If price keeps bouncing from the same lower area, that support level matters. If price keeps failing near the same upper area, that resistance zone matters. Those reactions help you understand where price is holding up and where it is struggling.
Mirror Levels Show How Price Remembers Old Zones
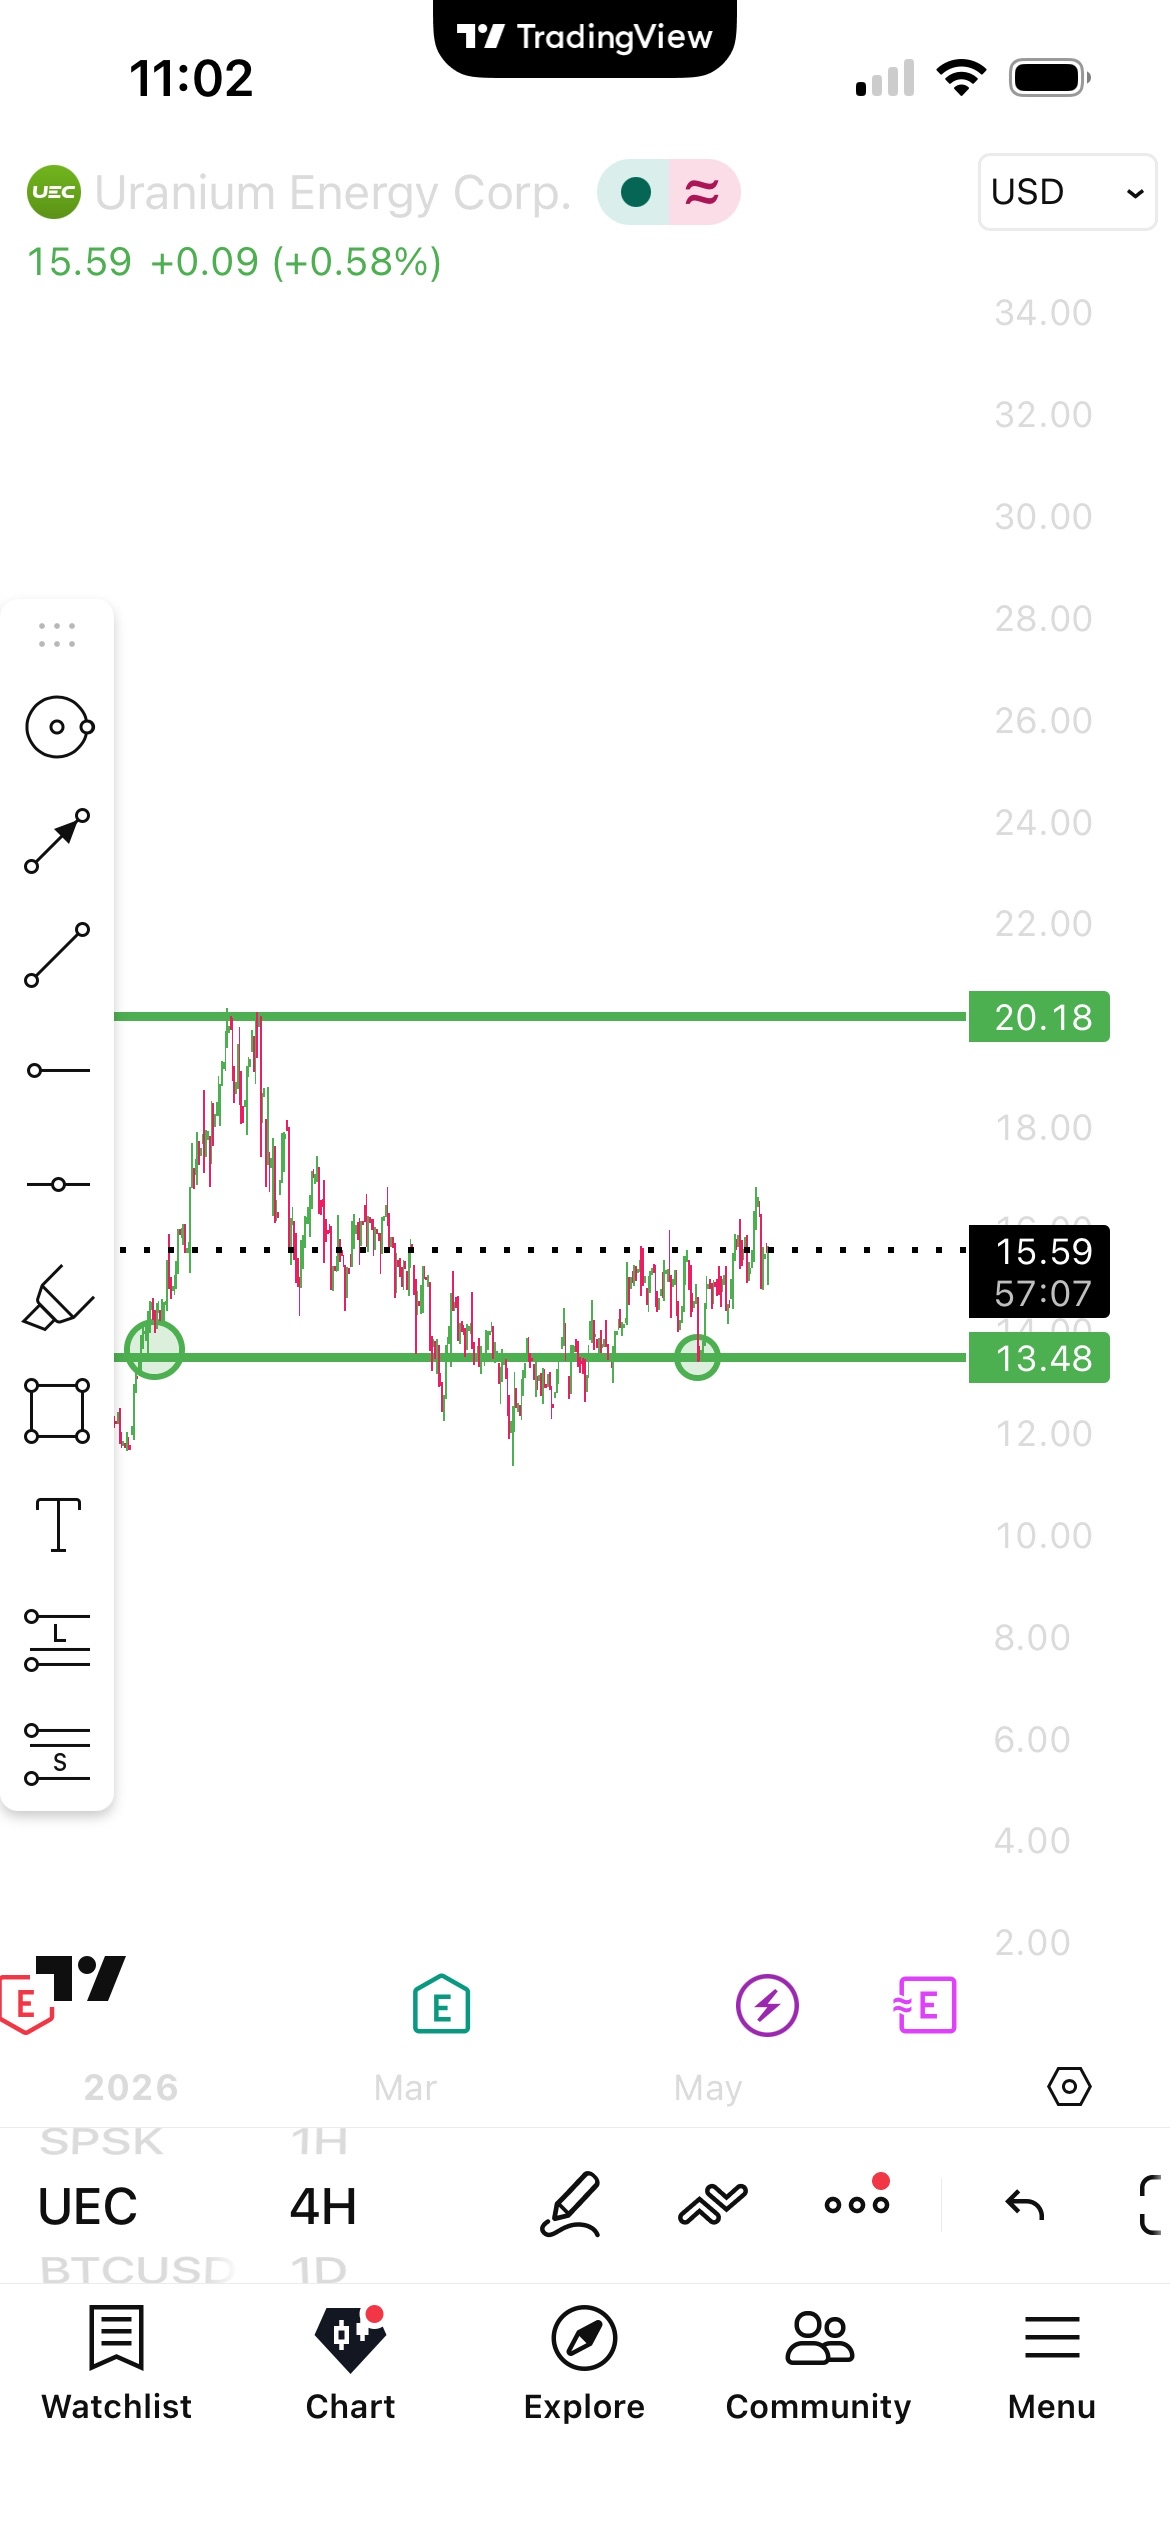
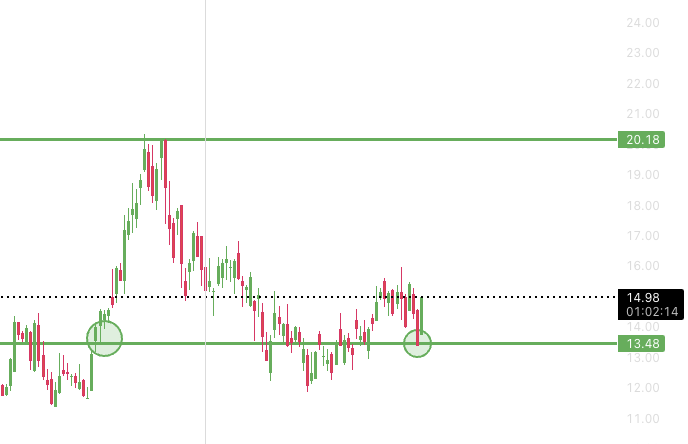
One of the most useful chart ideas is the mirror level. That happens when a zone that used to act like resistance later starts acting like support, or when old support later becomes resistance.
This matters because it shows that levels are not random. Price often remembers important zones. Learning to spot that transition helps you read the chart with more logic and less guessing.
Step-By-Step Reading Process
- Zoom out first so you can see the broader structure.
- Mark the obvious support and resistance zones.
- Look for repeated reactions, not one random candle.
- Notice whether an old level is flipping into a mirror level.
- Only then zoom in if you want a more precise entry idea.
The goal is not to predict every move. The goal is to understand where the chart is, what level matters now, and how price is behaving around that level.
Honest limit: even a well-read chart can still break structure and move the other way. Good chart reading improves clarity, but it does not remove uncertainty or risk.
FAQ
What does it mean to read a stock chart like a map?
It means using the chart to identify areas where price has already reacted, then treating those areas like landmarks. Support, resistance, and structure help you understand where price is and what zones matter next.
What should beginners look for first on a stock chart?
Beginners should start with the bigger picture: trend direction, support, resistance, and whether price is reacting at levels that have already mattered before.
What is a mirror level on a stock chart?
A mirror level is a price area that once acted like resistance and later starts acting like support, or the other way around. It shows how a level can switch roles over time.
Do I need indicators to read a stock chart correctly?
No. Indicators can add context for some traders, but you can learn a lot just from structure, support, resistance, and how price reacts around important areas.
Does reading a stock chart guarantee a winning trade?
No. Chart reading improves decision quality, but markets can still break levels and invalidate the idea. The chart gives context, not certainty.
If you want the next step after this, visit Trading mentorship and education. If you want the crypto version of this lesson too, read How to Read a Bitcoin Chart (Complete Beginner Guide 2026).
Want Help Reading Charts More Clearly?
Pick one clean next action instead of bouncing around the site.
Trading
Trading Classes $50/hour or $450 for 10
Schedule first, then work through chart reading, support levels, entries, exits, risk, psychology, and review with StackmodeChris.
Catch Our Trades
Catch Our Trades
Real-time trading entries, trade recaps, and market breakdowns from StackmodeChris.
StackFinder
StackFinder Research Tools
Free market scanner, watchlists, and trade-prep tools for stocks, options, futures, forex, and crypto.