
Use Stackmode market breakdowns to connect economic releases, chart structure, and risk decisions without treating one number as a guarantee.
Quick Answer: CPI Is an Inflation Input, Not a Trading Signal
The Consumer Price Index, or CPI, tracks how prices change over time for a measured basket of consumer goods and services. Investors watch it because inflation data can influence expectations for interest rates, bond yields, liquidity, and risk appetite. Those changes can affect stocks, bonds, crypto, currencies, and other assets.
CPI is important because it helps describe the inflation environment, but one release cannot predict the next market move. Interpret the result against expectations, inspect the categories driving the change, compare it with the broader trend, and use a written risk plan instead of chasing the first candle.
Watch the Video: Why CPI Matters for Investors
Watch the original StackmodeChris lesson, then use this guide to separate what CPI measures, how policymakers may interpret it, and how markets can price the result.
CPI Basics: Basket, Weighting, and Inflation Rates
CPI is built from prices across categories such as shelter, food, energy, transportation, medical care, and other consumer expenses. Each category has a weight intended to represent its importance in consumer spending. That means the index is an average: a household can experience a different personal inflation rate depending on what it buys.
Headline CPI
Includes all measured categories, including volatile food and energy prices.
Core CPI
Excludes food and energy to focus on underlying trends, while leaving out important household costs.
Year Over Year
Compares prices with the same period a year earlier; the base can affect how the rate looks.
Monthly changes and year-over-year changes answer different questions. A cooling annual rate can coexist with prices that are still rising month to month, so read the time period and measure carefully.
How To Read a CPI Release Without Overreacting
Start with the reported headline and core figures, but do not stop there. The details can show whether the move came from shelter, energy, transportation, food, services, or goods. A similar headline can carry a different market meaning depending on which components changed and whether the trend is broad or concentrated.
- Compare with expectations: the surprise relative to forecasts can matter more than the raw number.
- Check the trend: compare recent releases rather than treating one month as a new regime.
- Inspect components: identify which categories are pushing the index and whether the pressure is broad.
- Watch policy implications: inflation data can change rate expectations, but central-bank decisions use more than CPI.
- Wait for price confirmation: the initial move can reverse as traders digest the report and positioning adjusts.
Use the U.S. Bureau of Labor Statistics CPI resources for the primary release, methodology, tables, and current category details. Historical data and definitions can change how an old headline should be interpreted.
How CPI Can Affect Stocks, Bonds, and Crypto
CPI matters to markets through expectations. A hotter-than-expected result can lead investors to price a more restrictive rate path, while a cooler surprise can support a softer policy expectation. Neither outcome guarantees a direction because markets also respond to growth, earnings, employment, liquidity, positioning, and global events.
| Market Channel | Possible Effect | What To Check |
|---|---|---|
| Rates and bonds | The report may change expectations for future policy and yields. | Compare the release with rate expectations and the bond-market response. |
| Growth stocks | Higher yields can change how investors value distant future cash flows. | Separate the macro move from company earnings and valuation. |
| Crypto | Liquidity and risk appetite can shift, sometimes with sharp volatility. | Check leverage, liquidity, dollar strength, and price confirmation. |
| Consumer sectors | Different inflation categories can affect household demand and margins. | Review the actual exposure rather than applying a blanket market rule. |
Build an Investor Process Around CPI
CPI is most useful when it becomes part of a repeatable process. Decide in advance what you are measuring, which assets are exposed, and what evidence would change your view. This reduces the chance that a dramatic headline turns into an unplanned trade.
- Write your time horizon and whether the position is an investment or a short-term trade.
- Review the release against the forecast and the recent trend.
- Identify the data component that matters most to your thesis.
- Define position size, invalidation, and maximum acceptable loss before the release.
- Wait for spreads, volatility, and price discovery to normalize when appropriate.
- Journal the decision and outcome so the next CPI release becomes a reviewable process.
For broader macro-to-crypto context, read The Fed's Next Move: What a Rate Hike Means for Crypto. For long-term behavior, read Investing Is A Life Long Journey.
Common CPI Mistakes Investors Make
- Trading the headline only: the categories and surprise relative to expectations can matter more than the top line.
- Assuming lower is always bullish: markets can react differently when growth, policy language, or positioning changes.
- Confusing inflation with prices: a slower rate of increase does not mean prices returned to earlier levels.
- Ignoring the base effect: year-over-year comparisons can look different as the comparison month changes.
- Using leverage to express a guess: a fast data release can create slippage, reversals, and losses larger than planned.
Risk and Honest Limits
CPI is an important economic indicator, not a complete forecast of the economy or a guaranteed market signal. Data can be revised, expectations can change, and assets can move opposite the textbook reaction. This article is educational and does not provide financial, legal, or tax advice or guarantee an investment result.
Verify the current release and methodology from the BLS before acting, and use risk capital only. Do not increase size because a prior CPI reaction worked, and do not treat a single report as proof that a trend will continue.
FAQ
What is the Consumer Price Index?
The Consumer Price Index measures the average change over time in prices paid by consumers for a selected basket of goods and services. It is a broad inflation indicator, not a complete measure of every household’s personal cost of living.
What is the difference between headline CPI and core CPI?
Headline CPI includes all measured categories, including food and energy. Core CPI excludes food and energy to make underlying price trends easier to analyze, but it can omit categories that matter substantially to household budgets.
Why can CPI move stocks and crypto?
CPI can influence expectations for interest rates, liquidity, bond yields, and risk appetite. The market reaction depends on the result relative to expectations, the details inside the report, positioning, and other economic information.
Does a lower CPI always make markets go up?
No. Markets can fall after a lower reading if the result was already expected, if other data is negative, if policy communication remains restrictive, or if positioning causes a different reaction. One release is not a guaranteed direction signal.
How should investors use CPI data?
Use CPI as one input in a broader process. Compare the release with expectations, inspect the components and trend, consider your time horizon and risk, and avoid increasing position size solely because of a single data point.
Continue with Ethereum Explained, visit Stackmode crypto education, or study market breakdowns through Catch Our Trades.
Best-Fit Framework: What This Topic Can and Cannot Tell You
Understanding CPI: Why It's Critical for Investors is best understood as an educational framework: define the decision, compare the available choices, verify current evidence, and keep the downside explicit before acting.
| Option or lens | Best for | Honest limit |
|---|---|---|
| Definition | Clarifying what the topic actually means | A definition does not predict a market outcome. |
| Process | Turning the idea into repeatable research steps | A process still depends on execution and current conditions. |
| Risk check | Sizing uncertainty and writing invalidation rules | Risk controls reduce exposure; they do not remove loss. |
Research Checklist and Related Stackmode Lessons
Use primary sources for current rules and the related Stackmode pages for connected market context. The links are learning paths, not promises that a result will transfer from one market or person to another.
Visual Study Opportunities
These are useful visual checkpoints for a future revision or companion graphic. They make the explanation easier to scan without presenting an unverified chart, number, or performance claim as proof.
- 1. A one-sentence definition card with the key term highlighted.
- 2. A labeled process diagram showing research before execution.
- 3. A comparison table with the same criteria across alternatives.
- 4. A before-and-after example that clearly labels assumptions.
- 5. A timeline showing which facts are current and which are historical.
- 6. A risk ladder from low complexity to high complexity.
- 7. A checklist for source, date, cost, liquidity, and invalidation.
- 8. A worked example using hypothetical values rather than a promise.
- 9. A common-mistakes graphic with the correction beside each mistake.
- 10. A final decision tree showing when to pause and verify more evidence.
Expanded FAQ
What is the main idea of this article?
The main idea is to understand understanding cpi: why it's critical for investors as a process with defined assumptions, risks, and verification steps rather than as a guaranteed outcome.
Who is this article for?
It is for readers who want an educational framework before making a market, trading, or investing decision.
What should a beginner do first?
Start with the definition, identify the instrument or market involved, and write down the risk before thinking about an entry or action.
What information should be verified?
Verify the product rules, current data, costs, timing, liquidity, source date, and any claim that could change the decision.
What is the biggest mistake to avoid?
The biggest mistake is treating an educational explanation as a promise and skipping independent risk checks.
How does risk management fit in?
Risk management sets the position size, invalidation point, maximum loss, and review process before execution.
Can this approach guarantee a profit?
No. Markets are uncertain, and no framework can guarantee a profit or remove loss risk.
How current is this information?
Market rules, prices, products, and policy can change, so check the dated primary source before acting.
Should this replace professional advice?
No. It is general education, not personalized financial, tax, legal, or investment advice.
How should readers compare alternatives?
Compare the same criteria: purpose, issuer, liquidity, costs, volatility, custody, time horizon, and honest limitations.
What should be written in a trading plan?
Record the thesis, setup, entry condition, invalidation, size, maximum loss, exit logic, and review date.
Why do source dates matter?
A dated source shows when a rule, number, or statement was true and helps expose stale or unsupported claims.
How can readers reduce confirmation bias?
Write what would disprove the thesis, review opposing evidence, and avoid relying on one headline or one chart.
What is a sensible next step?
Use the article as a checklist, verify the primary sources, and practice with risk that is small enough to survive mistakes.
Where can readers continue learning?
Use the linked Stackmode lessons for market context and the linked regulator or exchange resources for current rules.
Conclusion: Use the Framework, Then Verify the Decision
Understanding CPI: Why It's Critical for Investors is best understood as an educational framework: define the decision, compare the available choices, verify current evidence, and keep the downside explicit before acting. The useful takeaway is not a prediction. It is a repeatable process: define the topic, compare the available choices, verify current sources, size risk conservatively, and record what would change your mind.
Stackmode provides educational market context, not guaranteed returns or personalized financial advice. Recheck current rules, prices, liquidity, and tax implications before acting.
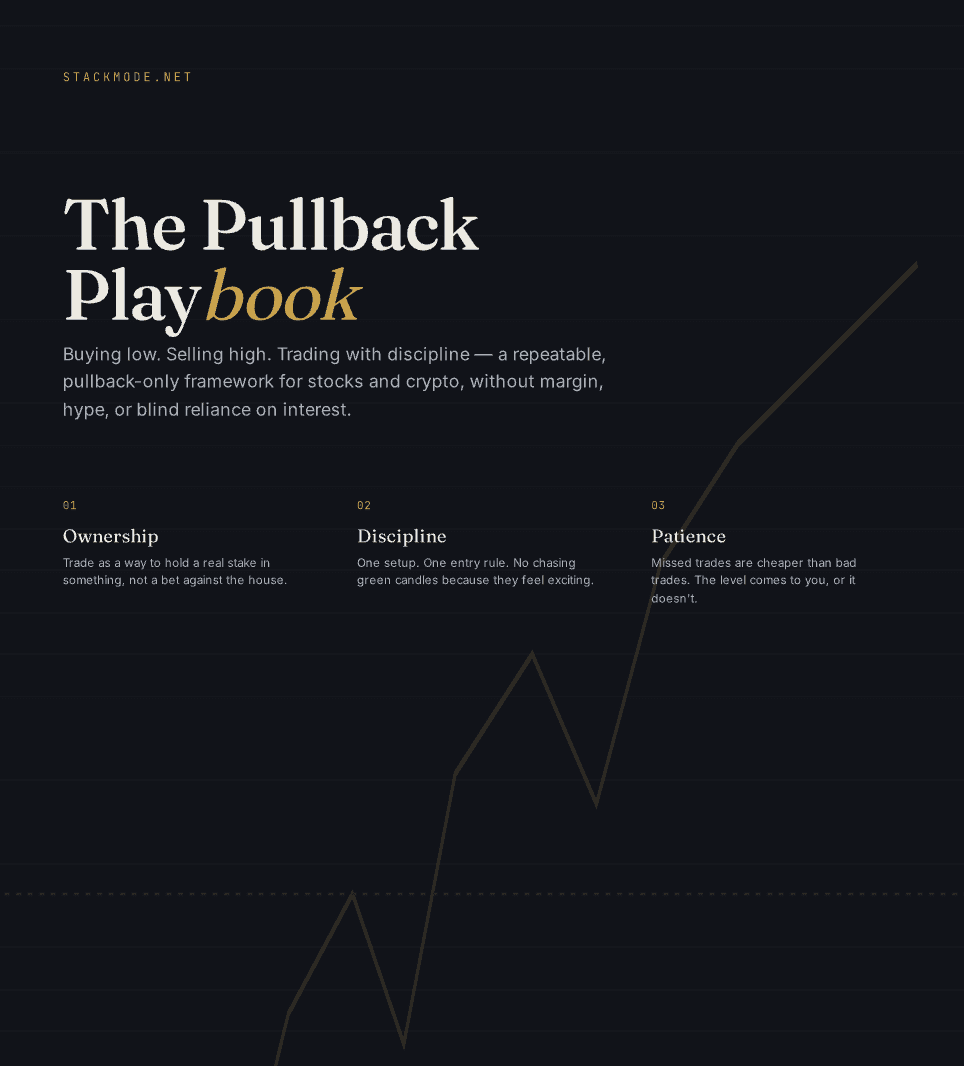
Free trading playbook
Build the plan before you place the trade.
Get the Stackmode playbook for pullbacks, risk limits, entries, exits, and trade review. It is a practical first step before you sign up for the Trading School.
- • Define the setup before entry
- • Mark invalidation and risk
- • Stop chasing moves
- • Review decisions, not just results
Opens the external Stackmode playbook page. Education only.
Trading Books
Keep Learning After The Article
Pick the book that matches the skill you want to practice next. Each one gives you a focused framework to work through after this article, with Amazon paperback and eBook options available.
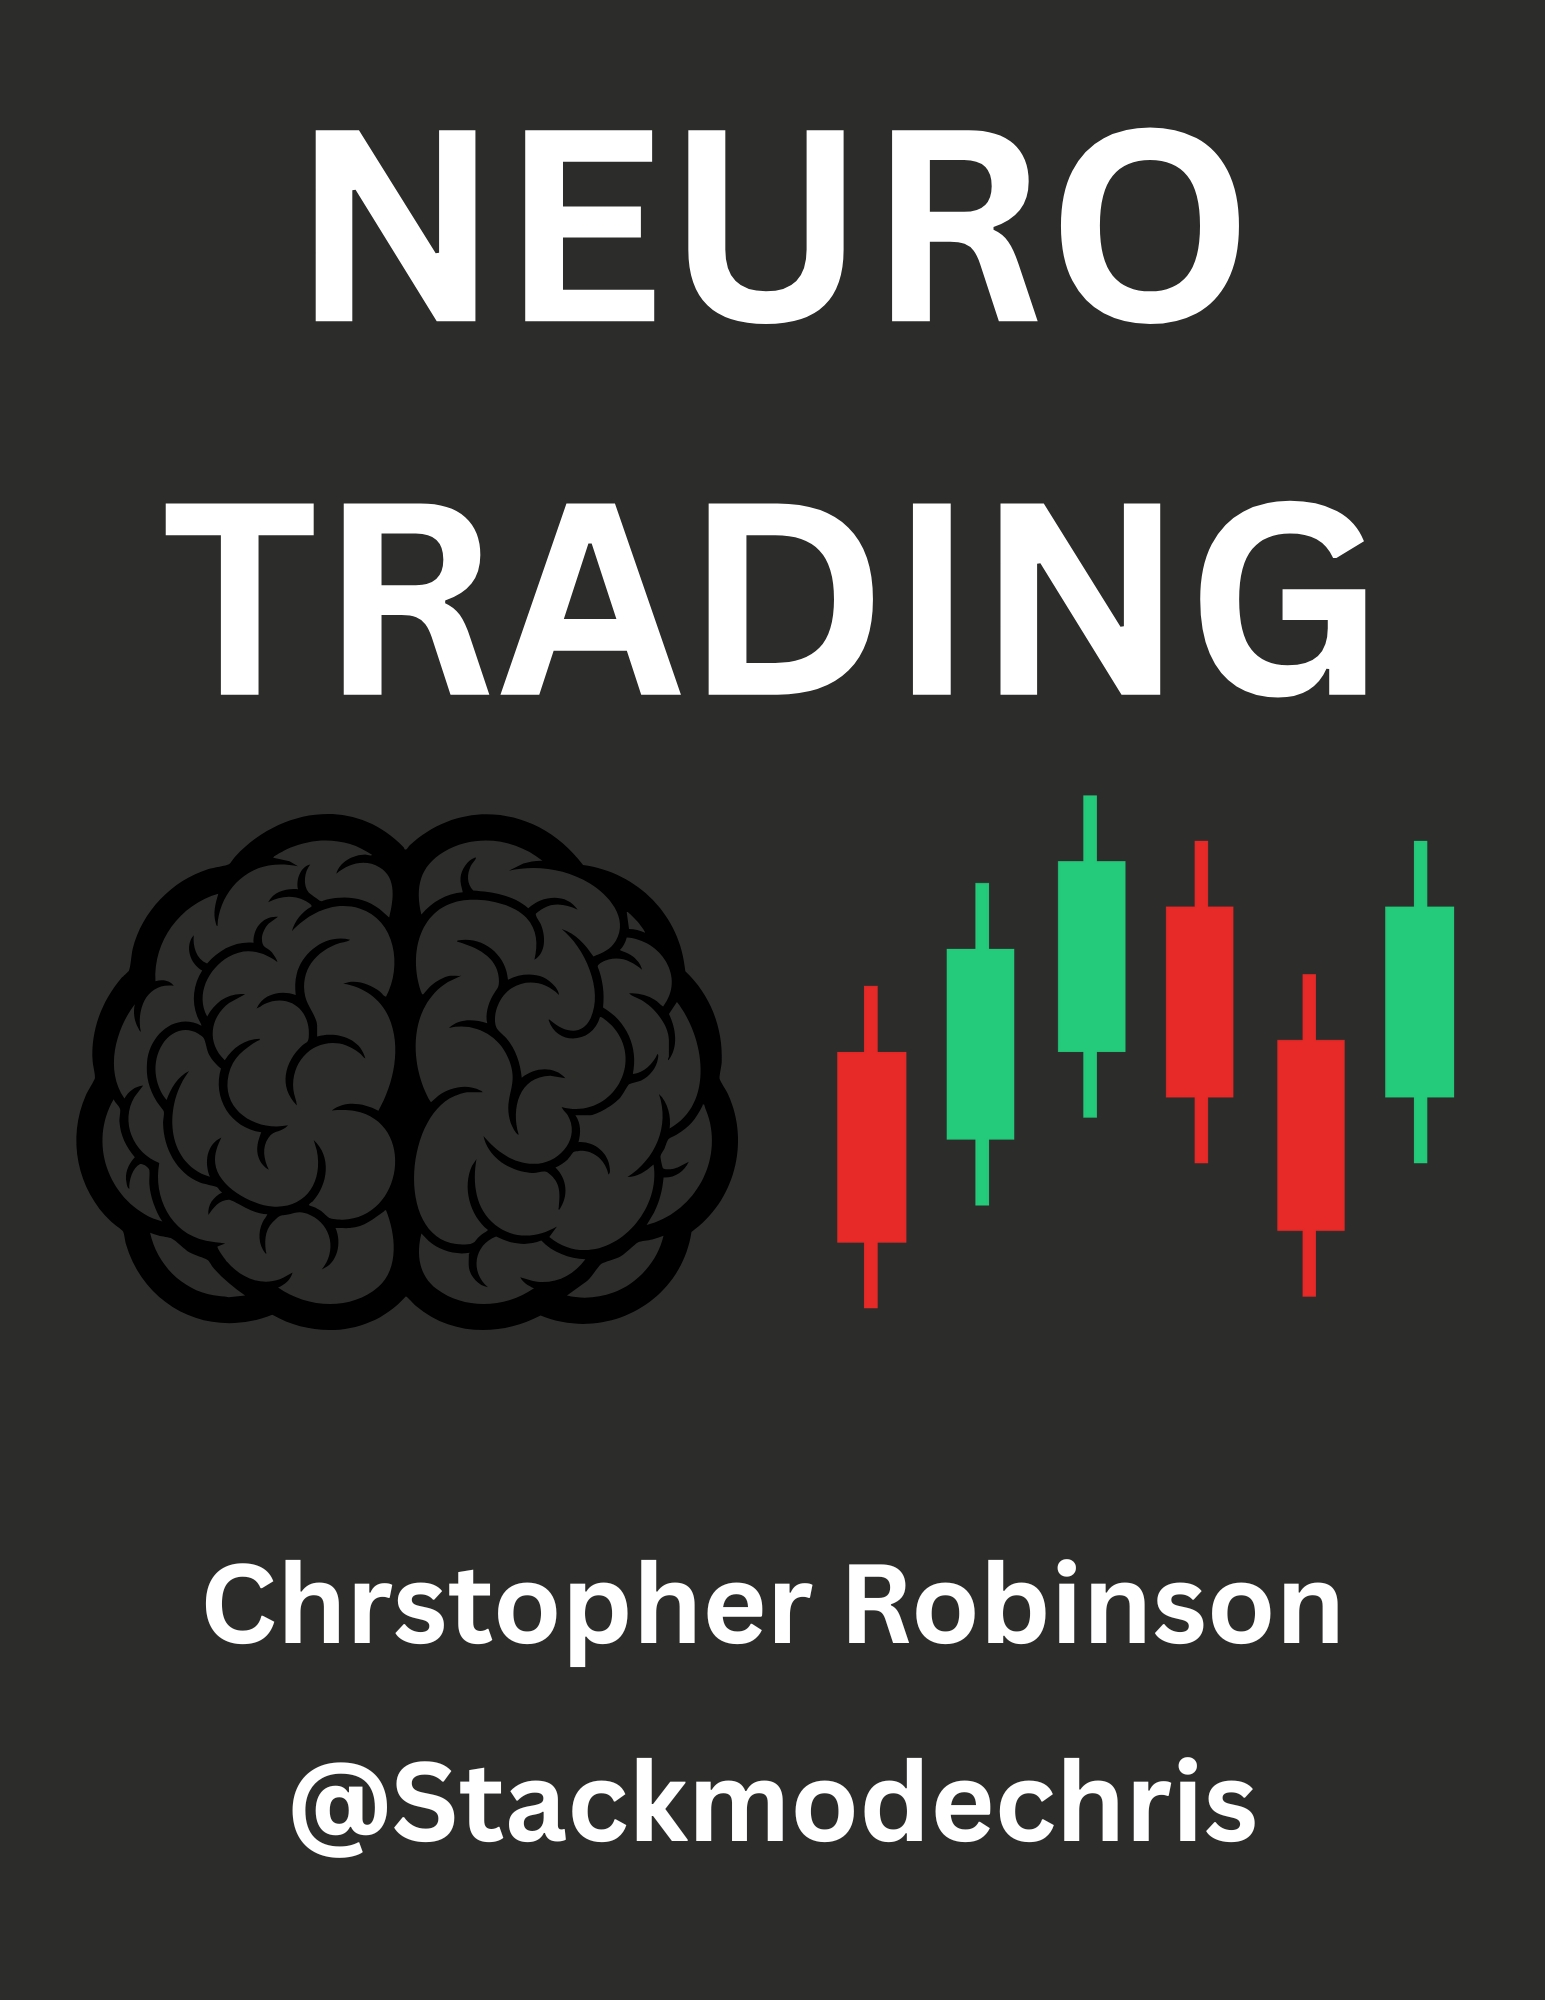
Recommended starting point
Neuro Trading
Master the psychology of trading.
- Why 90% of traders lose and how to think like the 10%
- Emotional discipline techniques used by stronger traders
- A mindset framework built for long-term execution
eBook
$9.99
Paperback
$19.99
Audiobook
$9.99
Before The Hype
How to spot opportunities before they go viral.
- Learn the asset stacking strategy for long-term wealth
- Find high-signal trends before they become crowded
- Think earlier instead of chasing late momentum
eBook
$9.99
Paperback
$19.99
Audiobook
$9.99
Freedom Money
Understand Bitcoin and what it does.
- A cleaner beginner path into Bitcoin
- Protect and grow money with stronger awareness
- Build conviction before you move capital
eBook
$9.99
Paperback
$19.99
Audiobook
$9.99
Study the Data Before You Trade the Reaction
Pick one clean next action instead of bouncing around the site.
START HERE
Stackmode Trading School
Join the school for live classes, market review, organized lessons, StackFinder access, and member support. $499/year — StackFinder included.
Best value
StackMode Trading School
Live group sessions, stock and crypto market review, organized video lessons, StackFinder access, and a Halal spot-trading framework. $499/year.
Live class plan
Live Group Sessions Included
Bring questions, review charts, and learn the same repeatable process with students moving through the class plan together.
StackFinder
StackFinder Member Tools
AI scanner, personal watchlist, daily stock and crypto setups, dashboards, and trade-prep tools are included with the group.
Education and risk disclosure
Stackmode provides education, tools, examples, and market commentary only. Nothing on this site is personalized financial, investment, tax, or legal advice, and no result, trade recap, screenshot, testimonial, alert, or example is a promise of future performance. Trading and investing involve substantial risk of loss, including the possible loss of capital. You are responsible for your own decisions, position size, broker selection, tax treatment, and compliance with the laws and rules that apply in your location.
Read the full risk disclosure