
Resistance is easier to read when you understand supply, demand, risk, and what volume is actually saying instead of guessing off emotion.
Quick Answer: Resistance Is Where Earlier Sellers Often Show Up Again
Stocks fall at resistance because that level already showed proof that sellers were active there before. When price returns, profit takers, cautious buyers, and fresh sellers can all meet at the same area, which makes rejection more likely than many beginners expect.
Resistance is not magic. It is memory. The chart remembers where supply previously overwhelmed demand, and traders react to that memory in real time.
Watch the Video First if You Want the Short Breakdown
This article expands on the StackModeChris video and turns the idea into a cleaner written lesson. Watch the video first if you want the fast explanation, then use the sections below to understand why resistance keeps punishing late entries.
Why Resistance Works So Often
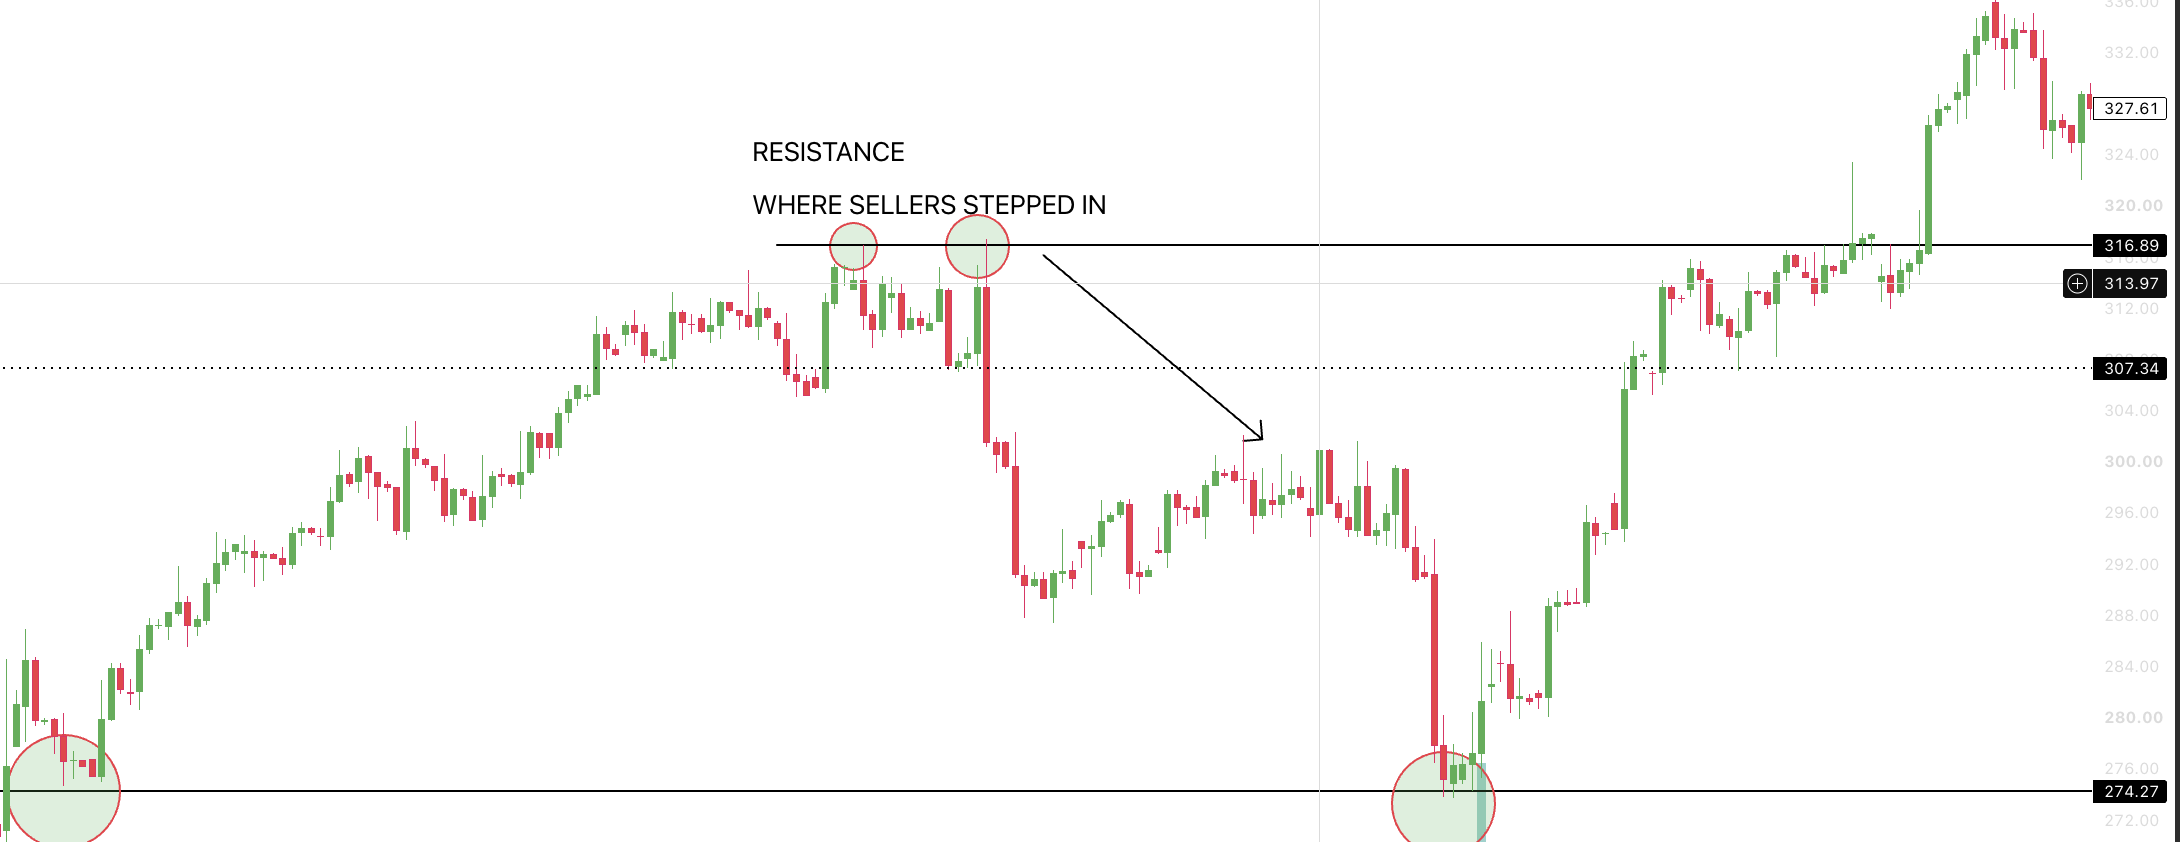
Resistance matters because it marks a place where the market previously struggled to move higher. That means somebody sold there, somebody took profit there, or buyers simply ran out of strength there. When price comes back, those same behaviors can repeat.
Think about the psychology. Traders who bought lower may say this is a good place to lock in gains. Traders who got trapped near the level earlier may use the retest to get out at break-even. New short-term sellers may also see the same zone and attack it again.
Profit taking
Traders who bought lower may choose the same obvious ceiling to realize gains, which adds selling pressure.
Trapped buyers
Traders who entered poorly near the top may sell into the retest just to escape the trade with less damage.
Fresh supply
New sellers often identify the same level and use it as their risk-defined entry zone.
What Selling Volume Adds to the Picture
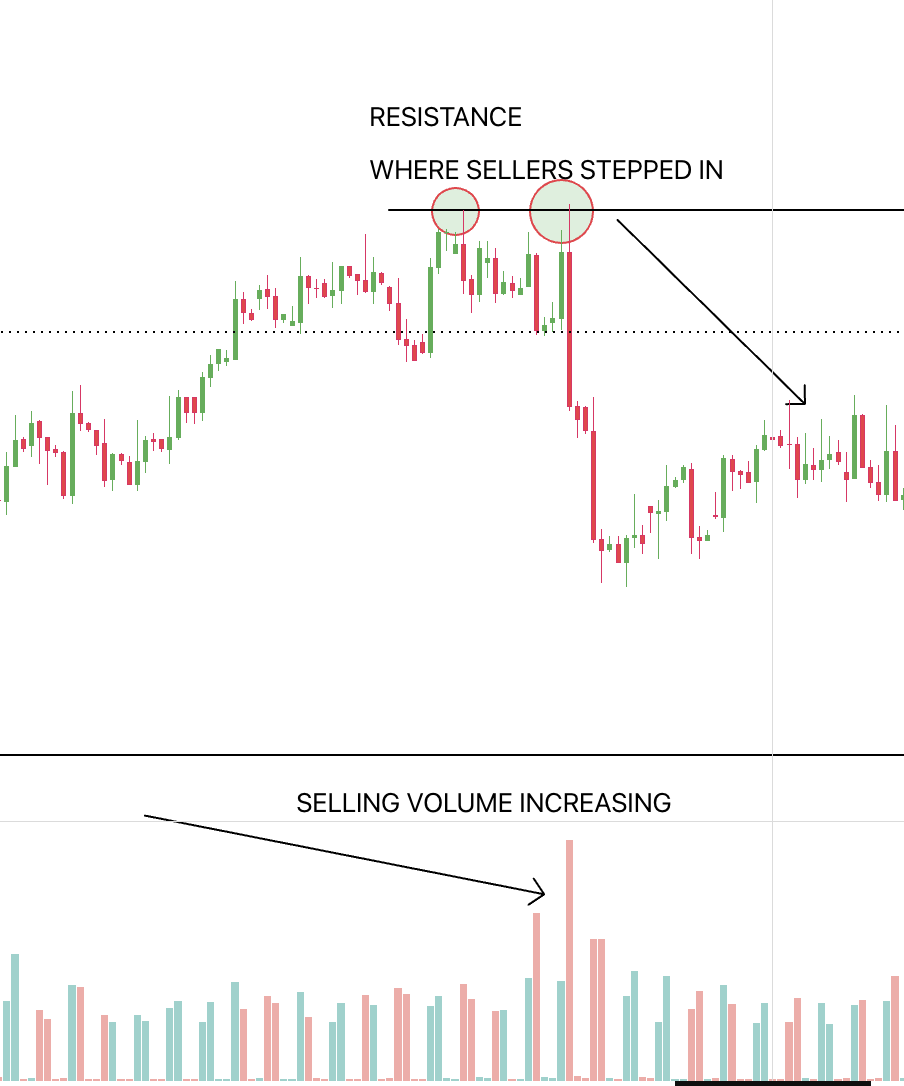
Price alone tells part of the story. Volume helps tell you how aggressive the story is. If rejection at resistance comes with expanding red volume, that can be a clue that sellers are not just present, they are pressing harder as price fails.
That does not mean every big red candle guarantees a collapse. It means the rejection has more context behind it. When price stalls at resistance and sell-side volume begins to build, the odds of a pullback can improve because supply is no longer hidden.
If you want to get better at reading this kind of behavior, pair this with How to Trade Stocks and How To Make ALOT More Money By Investing In Stocks & Bitcoin. The point is not memorizing one setup. The point is learning how price behaves around key decision zones.
Common Mistakes Traders Make Around Resistance
- Buying directly into a known ceiling without waiting for confirmation.
- Ignoring the increase in selling volume during rejection.
- Treating resistance like a guaranteed breakout level instead of a battle zone.
- Entering too large before price proves it can hold above the area.
- Forgetting that a failed breakout can move sharply in the opposite direction.
Honest limit: resistance is a probability concept, not a rule that works every single time. Strong momentum, news, or broad market strength can push price right through it. That is why resistance should guide your process, not replace it.
FAQ
Why do stocks often fall at resistance?
Stocks often fall at resistance because that area already proved sellers were willing to step in before. Traders who bought lower may take profits there, late buyers can hesitate, and new sellers may use the level to defend price again.
Does resistance always cause a stock to drop?
No. Resistance is a probability area, not a guarantee. Strong momentum, heavy buying, fresh catalysts, or a clean breakout with follow-through can push price through it.
Why does volume matter near resistance?
Volume helps show whether the battle at resistance is weak or aggressive. Rising sell-side volume during rejection can confirm that supply is hitting the market harder than demand at that moment.
Is this article financial advice?
No. This article is educational and explains market structure. It is not a personalized trading recommendation or a promise of how any stock will behave next.
The key lesson is simple: when price reaches a known resistance area, do not assume upside just because the chart was strong before. Ask whether sellers are returning, whether volume is changing, and whether the market is actually accepting higher prices or rejecting them.
Learn Market Structure With a Real Process
Pick one clean next action instead of bouncing around the site.
Trading
Trading Classes $50/hour or $450 for 10
Schedule first, then work through chart reading, support levels, entries, exits, risk, psychology, and review with StackmodeChris.
Catch Our Trades
Catch Our Trades
Real-time trading entries, trade recaps, and market breakdowns from StackmodeChris.
StackFinder
StackFinder Research Tools
Free market scanner, watchlists, and trade-prep tools for stocks, options, futures, forex, and crypto.